
CO2 monitoring using Prometheus, Shelly plugs and co2signal
This week I got my new Shelly plugs. This was the missing piece to properly monitoring the amount of CO2 produced by my devices’ electricity usage. In order to do this, I take the CO2 produced by the German power grid, that the co2signal API provides, normalise this data and multiply it by the watt minutes the devices have used in that period of time.
This is all done on Kubernetes with kube-prometheus-stack installed to provide a unified and simply environment that is easy to reproduce for anyone.
Theory Crafting
The whole idea behind the setup is quite simple: It doesn’t matter whether you have a “green electricity provider”, the power you get, is the power that the grid provides. Therefore, independent of your electricity provider, it’s a good idea to optimise for the CO21 production of the grid.
Exceptions are people with solar power or alike in their house, which might already produce energy in an off-grid situation. But queries can be adjusted to account for that.
Either way, providing such features in Kubernetes allows not just hobbyist, to utilise these measurement tools but also larger organisations that run Kubernetes clusters. It’s also useful for researchers to validate certain thesis of their work.
Collecting the CO2 production of the power grid
Disclaimer: Measurement of CO2 production at scale is not particularly exact, therefore one can assume that all CO2 production numbers provided are approximations (hopefully). This becomes even worse, because the numbers are only available once per hour and broken down into gramsCO2eq/wattminute. DO NOT CONSIDER ANY OF THESE NUMBERS TO BE EXACT.
In order to receive the data from the co2signal API2, an API key is required. Afterwards an installation of the Prometheus JSON exporter, which is provided via helm, can be configured to allow scraping it.
To provide useful helm values for the chart, create a file called co2-exporter.yaml and the following content:
 ---
configuration:
  config: |-
    ---
    serviceMonitor:
      enabled: true
      targets:
        - name: co2signal
          url: https://api.co2signal.com/v1/latest?countryCode=DE # Instructs kube-prometheus-stack to fetch the API for Germany, adjust for your needs in different countries.
          interval: 300s # Given the hourly resolution and the rate-limit of the API, scraping this endpoint more often has no benefit.

    modules:
      default:
        metrics:
        - name: co2_grams_per_kilowatthour
          valuetype: gauge
          help: Carbon Intensity by gCO2eq/kWh
          path: '{ .data.carbonIntensity }'
          labels:
            country: '{.countryCode}'
        - name: co2_fossil_fuel_percents
          valuetype: gauge
          help: Percentage of fossil fuels in the energy mix
          path: '{ .data.fossilFuelPercentage }'
          labels:
            country: '{.countryCode}'
        headers:
          auth-token: <your auth token> # replace this with the token from co2signal.org
It’s deployed to a Kubernetes namespace using the following commands:
helm repo add prometheus-community https://prometheus-community.github.io/helm-charts
helm install co2-exporter prometheus-community/prometheus-json-exporter --version 0.5.0 --values co2-exporter.yaml
Collecting power usage metrics
To collect the power usage metrics a Shelly Plug S3 is used.
The first step is to create a Kubernetes Service of Type ExternalName, which functions like a CNAME and makes it easier to reference devices in the follow up steps. If there are multiple plugs, create one service per plug.
---
apiVersion: v1
kind: Service
metadata:
    name: shelly
spec:
    type: ExternalName
    externalName: <your shelly DNS address> # You have to adjust this to point at your Shelly Plug.
    ports:
        - port: 80
          name: http
          protocol: TCP
Further another json-exporter instance will be deployed which will query the Shelly plugs using the following values in shelly-exporter.yaml:
configuration:
      config: |-
        ---
        modules:
          default:
            metrics:
            - name: shelly_uptime_seconds
              valuetype: counter
              help: Seconds elapsed since boot
              path: '{ .uptime }'
            - name: shelly_ram_total_bytes
              valuetype: gauge
              help: Total amount of system memory in bytes
              path: '{ .ram_total }'
            - name: shelly_ram_free_bytes
              valuetype: gauge
              help: Available amount of system memory in bytes
              path: '{ .ram_free }'
            - name: shelly_fs_size_bytes
              valuetype: gauge
              help: Total amount of the file system in bytes
              path: '{ .fs_size }'
            - name: shelly_fs_free_bytes
              valuetype: gauge
              help: Available amount of the file system in bytes
              path: '{ .fs_free }'
            - name: shelly_temperature_celsius
              valuetype: gauge
              help: Internal device temperature in °C
              path: '{ .tmp.tC }'
            - name: shelly_temperature_selfcheck_status
              valuetype: gauge
              help: Whether the internal temperature sensor functions correctly
              path: '{ .tmp.is_valid }'
            - name: shelly_relay_status
              valuetype: gauge
              help: Whether the channel is turned ON or OFF
              path: '{ .relays[0].ison }'
            - name: shelly_meter_power_watts
              valuetype: gauge
              help: Current real AC power being drawn, in Watts
              path: '{ .meters[0].power }'
            - name: shelly_meter_selfcheck_status
              valuetype: gauge
              help: Whether power metering self-checks OK
              path: '{ .meters[0].is_valid }'
            - name: shelly_meter_overpower_watts
              valuetype: gauge
              help: Value in Watts, on which an overpower condition is detected
              path: '{ .meters[0].overpower }'
            - name: shelly_meter_total_wattminutes
              valuetype: gauge
              help: Total energy consumed by the attached electrical appliance in Watt-minute
              path: '{ .meters[0].total}'
    serviceMonitor:
      enabled: true
      serviceMonitor:
          targets:
            - name: shelly
              url: http://shelly/status # the "shelly" in this URL references the service created above. Create multiple targets if you created multiple services
              interval: 15s # This provides us enough measurement points to avg the usage by minute
Now it’s just a matter of deployment:
helm install co2-exporter prometheus-community/prometheus-json-exporter --version 0.5.0 --values shelly-exporter.yaml
Prometheus will automatically start to collect the metrics if configured correctly.4
Note: If password-protection is used on the Shelly Plugs, adjust of the values file above is required to account for that.
Queries in Prometheus
With the groundwork done, it’s time to ask Prometheus for the metrics. After opening the Prometheus web interface, check for the metrics coming in:
shelly_meter_power_watts
co2_grams_per_kilowatthour
If metrics are missing, check the Prometheus targets and validate that the DNS name for the Shelly plug as well as the API key for co2signal are correct. It might take a few seconds to scrape the metrics.
The metrics can be utilised as in the example below:
avg_over_time(shelly_meter_power_watts[1m]) * scalar(last_over_time(co2_grams_per_kilowatthour[1h])/1000/60)
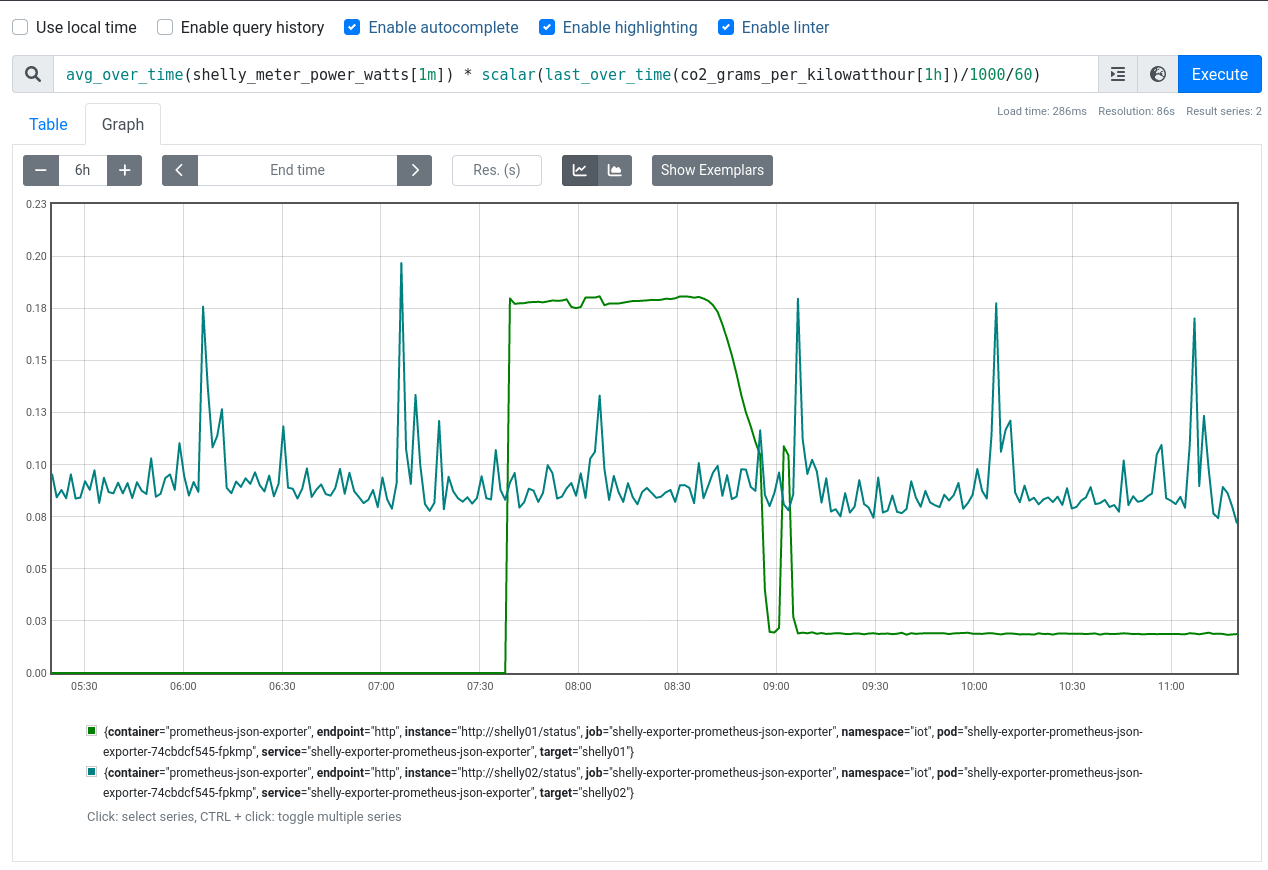
This metrics takes an average of the power consumption normalised to a minute, creating a watt minute, then it multiplies this, by the co2_grams_per_kilowatthour metric, which is first normalised to gramsCO2eq/wattminute by dividing it by 1000 (kW to W) and 60 (hour to minute). The result is a per minute breakdown of gramsCO2eq for the device(s) behind your Shelly plug. The last_over_time ensures that minor query problems with the upstream API do not cause gaps in the graph.
Now all that is left to do, is building dashboards or utilising this data otherwise.
Conclusion and Warning
Again, be very careful with this data, it’s not correct. It’s a very rough approximation, do not use it to state “XY produces Z CO2” or “A could save B grams of CO2 if they did C”. This is not how this works.
What you can do with this data: Validate thesis regarding the usefulness of schedules e.g. turning charging of devices off during night and on during daytime, in order to save CO2, or whether an adjustment of your scheduled tasks in Kubernetes has an influence on the CO2 footprint of your cluster.
All in all, it’s a nice setup to collect such data and conduct some research and experiments.
Further steps
A next step is to provide everything preconfigured as a helm chart. This would make it easier to install this setup with just two lines of scripting.
Another one is to validate some thesis I have built up over the past few weeks regarding the CO2 production of my devices and how to influence them.
And finally, adding more data sources into the mix, expanding on the measurement side to other areas and help to optimise workloads at scale, is definitely a long term goal.
-
When this blog article talks about CO2, CO2eq are meant. Wikipedia explains the unit in this article ↩
-
This API is mainly used, due to it’s “free” availability, the API is interchangeable. ↩
-
Again, one can change this, however there might be adjustment required for the follow up metrics mapping. Main reason for this particular model: They work offline and are cheap. ↩
-
Keep in mind to configure Network Policies in the namespace as well as adjusting the kube-prometheus-stack namespace selectors if needed. ↩